Chapter 4-1: Distribution Center Scale Calculation - Receiving & Inventory
Tera Calculation 2 Automatic: Distribution Center Scale Calculation Flowchart
We will explain the composition and learning objectives of "Tera Calculation 2", which is the main process for determining the scale of a distribution center.
1. Two Approaches of Tera Calculation 2
To deeply understand the "Distribution Center Scale Calculation", two methods—automatic and manual—are provided.
- Automatic Calculation (Tera Calculation 2 Automatic):
- This is software designed to efficiently learn the procedures and methods for calculating building and site areas.
- By automating complex calculations, you can quickly grasp the overall picture.
- Manual Calculation (Tera Calculation 3):
- This is software where users perform the calculations themselves by loading the data analyzed and aggregated in Tera Calculation 1, while referring to the results of the automatic calculation.
- The objective is to learn the rationale behind "why the area results in that size" through hands-on calculation.
2. Evolution of Software Composition and First Glance
In the initial stages of development, only automatic calculation was considered, but we found the issue that users would not acquire the practically important skill of "calculating specific areas for logistics equipment." Therefore, Tera Calculation 3 (manual calculation software), which allows users to trace the calculation logic themselves, was added, resulting in the current configuration.
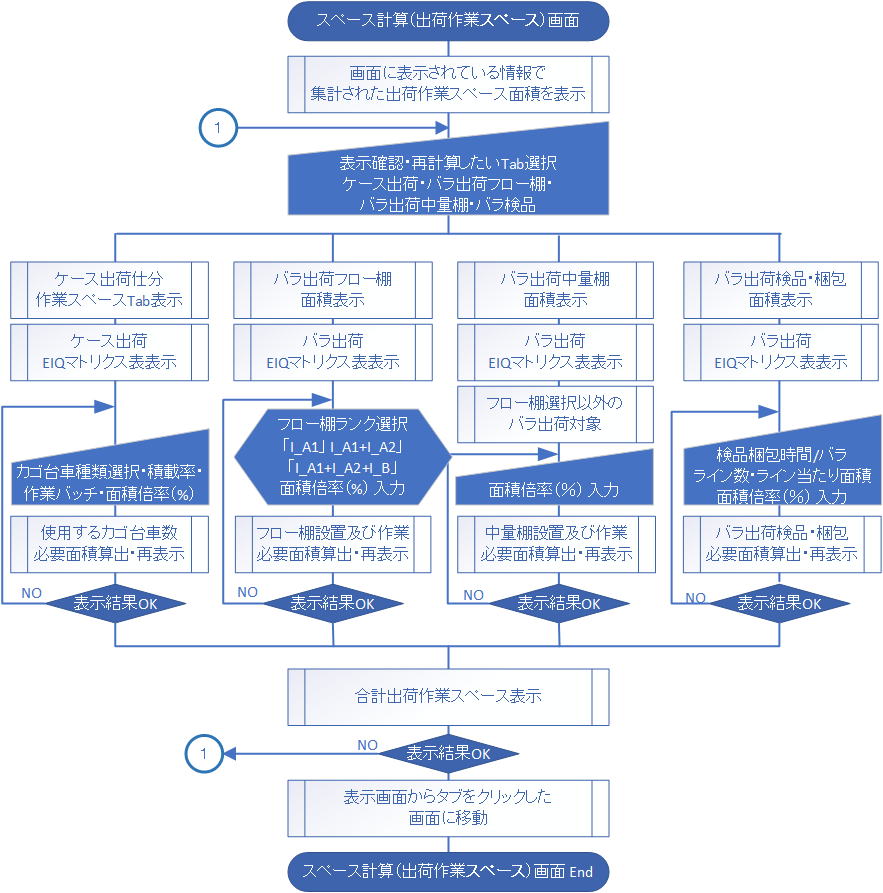
Overall Flow of Scale Calculation
In Tera Calculation 2, the physical scale of the distribution center is determined through the following steps.
- Estimation of Receiving and Inventory: Based on shipping data, identify the receiving volume and the storage volume during stable operations.
- Calculation of Logistics Equipment Space: Calculate the floor area occupied by the allocated equipment (automated warehouses, racks, sorters, etc.).
- Determination of Building Specifications: Simulate the vertical and horizontal dimensions of the building, including the number of floors and berth layouts.
- Calculation of Site Area: Derive the final required land area, including truck turning paths, parking lots, and green spaces.
Section 2: Automatic Calculation - Data Processing for Scale Calculation
Differences in Data Processing Between Tera Calculation 1 and Tera Calculation 2
Although the same shipping data is used, the main focus of processing differs depending on the purpose.
| Item |
Tera Calculation 1 (Shipping Data Analysis) |
Tera Calculation 2 (Distribution Center Scale Calculation) |
| Main Purpose |
Peak volume aggregation |
Aggregation of Required Storage Scale |
| Important Indicators |
Equipment capacity and workload on the maximum shipping day |
Average value of volume across all shipping days |
| Calculation Baseline |
Maximum shipping day |
Average of all shipping data |
⚙️ Features of Data Processing in Tera Calculation 2
It contains important logic for determining the physical specifications (such as total floor area) of the distribution center.
- Emphasis on PL (Pallet) Conversion: "PL Conversion" is adopted for the rank setting key. This is to accurately calculate the storage space, which occupies the largest area in the center.
- Two Reasons for Adopting the "Average Value":
- Prevention of Missing Data: If only a specific shipping day is used as a baseline, items that were not shipped on that day will be omitted from the calculation.
- Suppression of Overinvestment: Designing the area based on the peak day will result in an oversized scale. It is based on the concept that volume exceeding the average can be handled with "safety stock."
- Separation of Shipping Units: Similar to other calculations, case shipping and piece shipping are clearly separated and calculated independently.
Practical Points
- Flexibility of Verification: While the standard setting is the "average value," changing the Tera Settings allows scale calculations based on a "specified shipping day." You can derive optimal design values by verifying the scale differences based on these settings.
- Data Disclosure: The processed Access data (tables including piece counts and converted values for cases, PLs, volume, and weight) is open, allowing users to perform their own analyses independently.
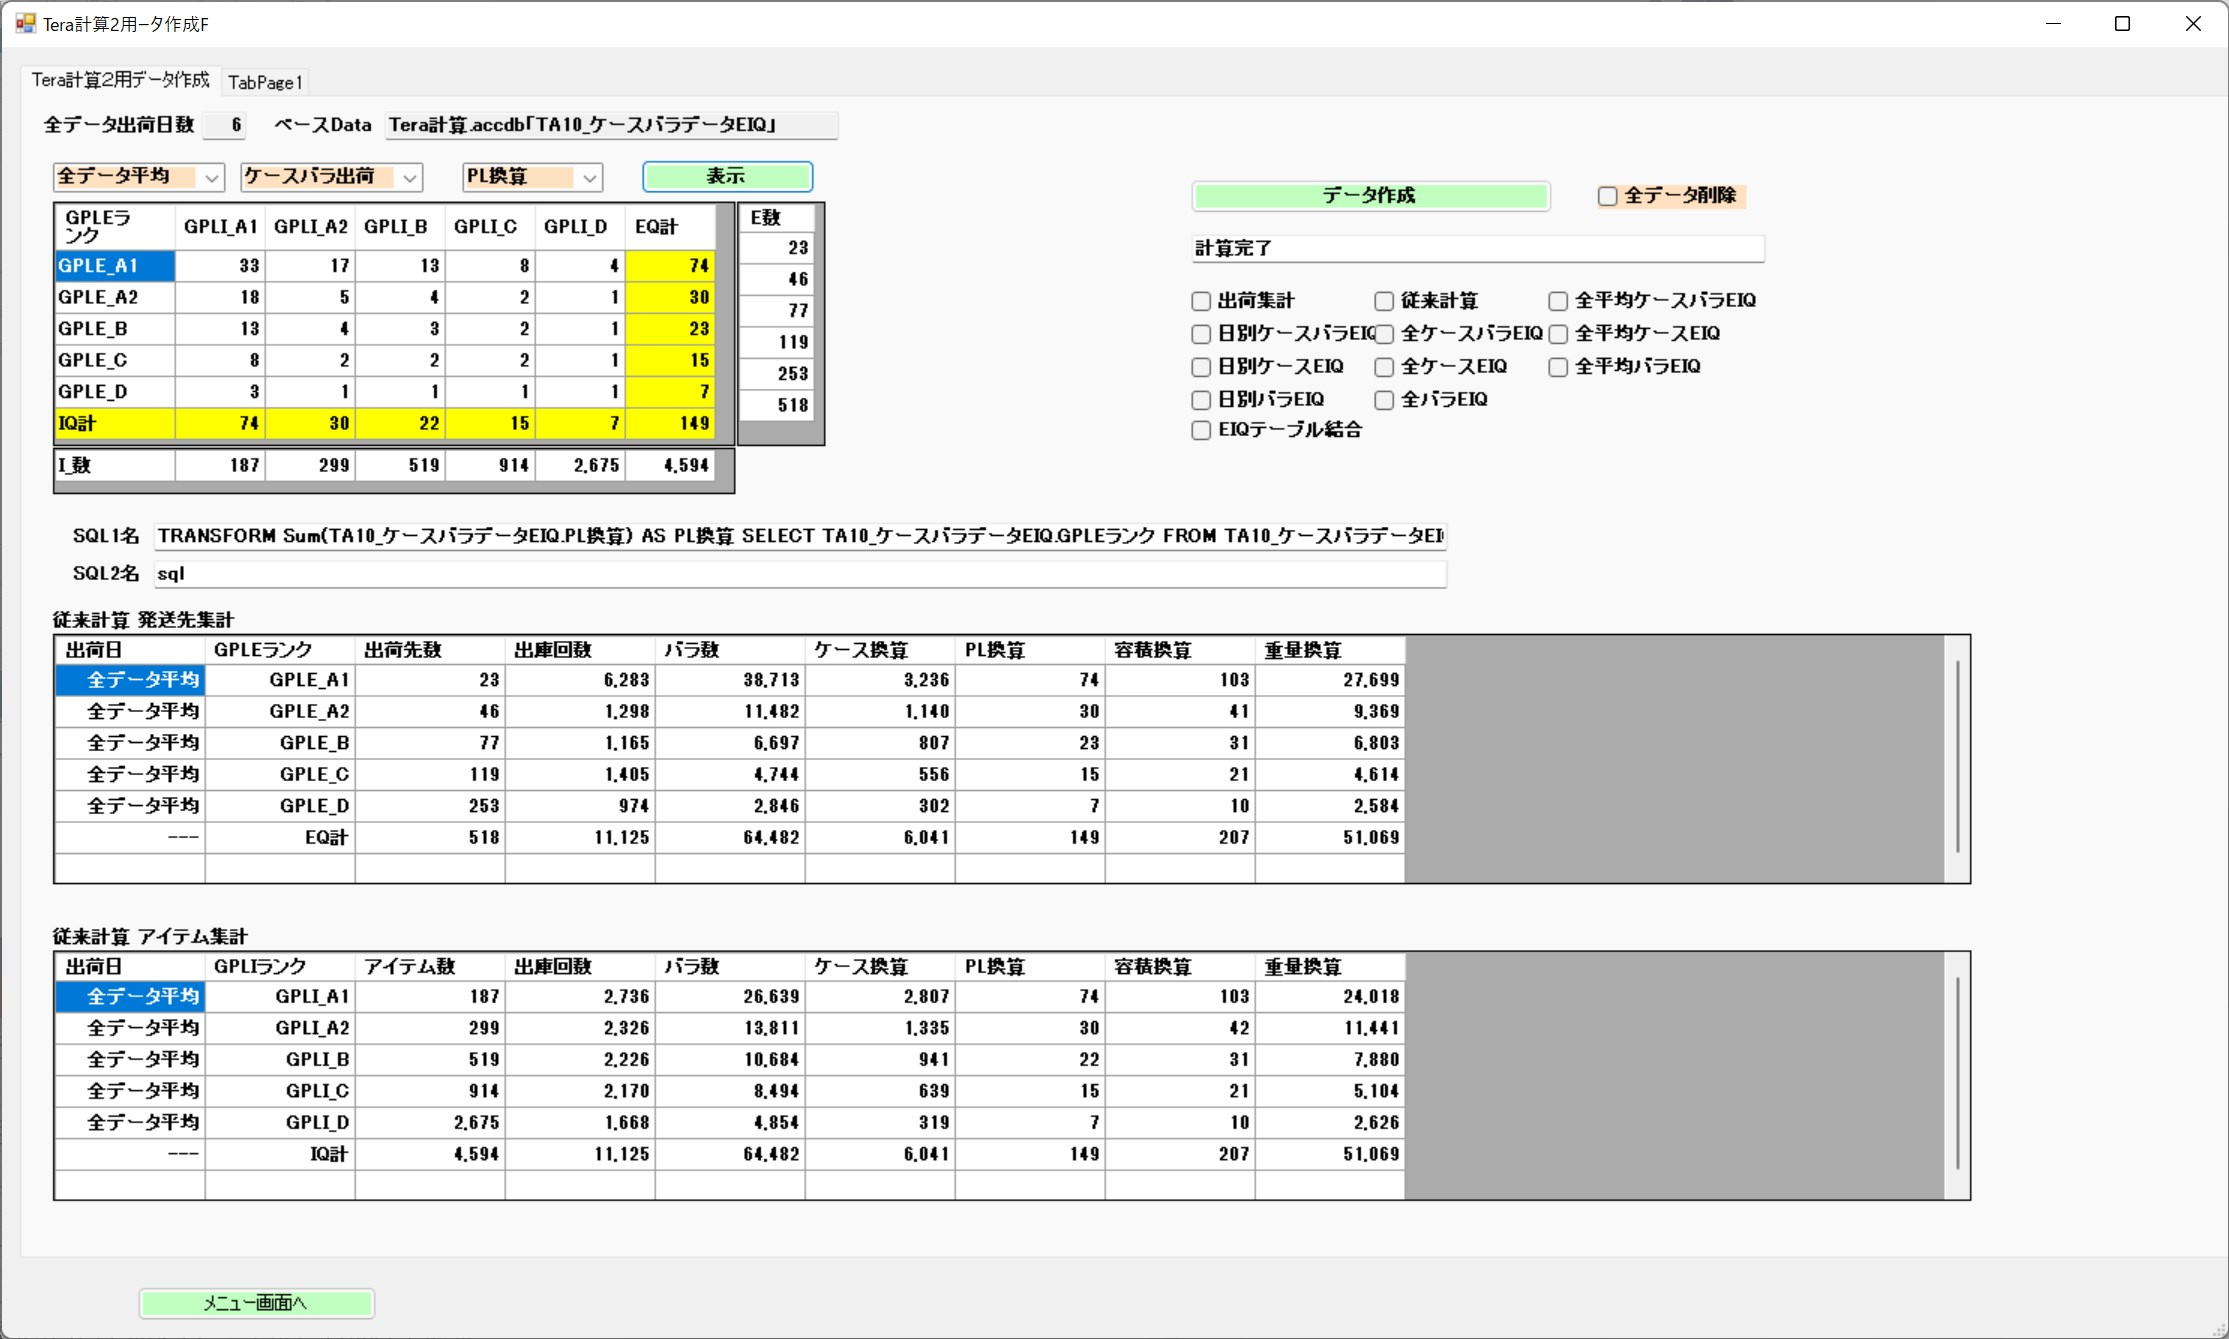
Tera Calculation 2 adopts PL conversion for its rank setting key.
This is because it focuses on pallet storage in the storage space, which accounts for a large ratio of the distribution center's area.
The source data is obtained from "T200", but the calculation data uses the average of all shipments (Tera Settings).
There are two reasons for this.
1. If a specific shipping day is used, items not shipped on that day will be omitted from the calculation.
2. If a high-volume shipping day is used, the distribution center scale will become unnecessarily large; days with shipments above average can be compensated for with safety stock.
Although the Tera Settings use the average of the overall data, calculations can also be made by specifying a shipping day, so please change the Tera Settings to verify the differences in scale.
As mentioned in other chapters, case shipping and piece shipping are separated and calculated individually.
These data sets include piece counts, case conversions, PL conversions, volume conversions, and weight conversions; the tables are made available so that you can use this Access data to test calculations other than Tera Calculation.
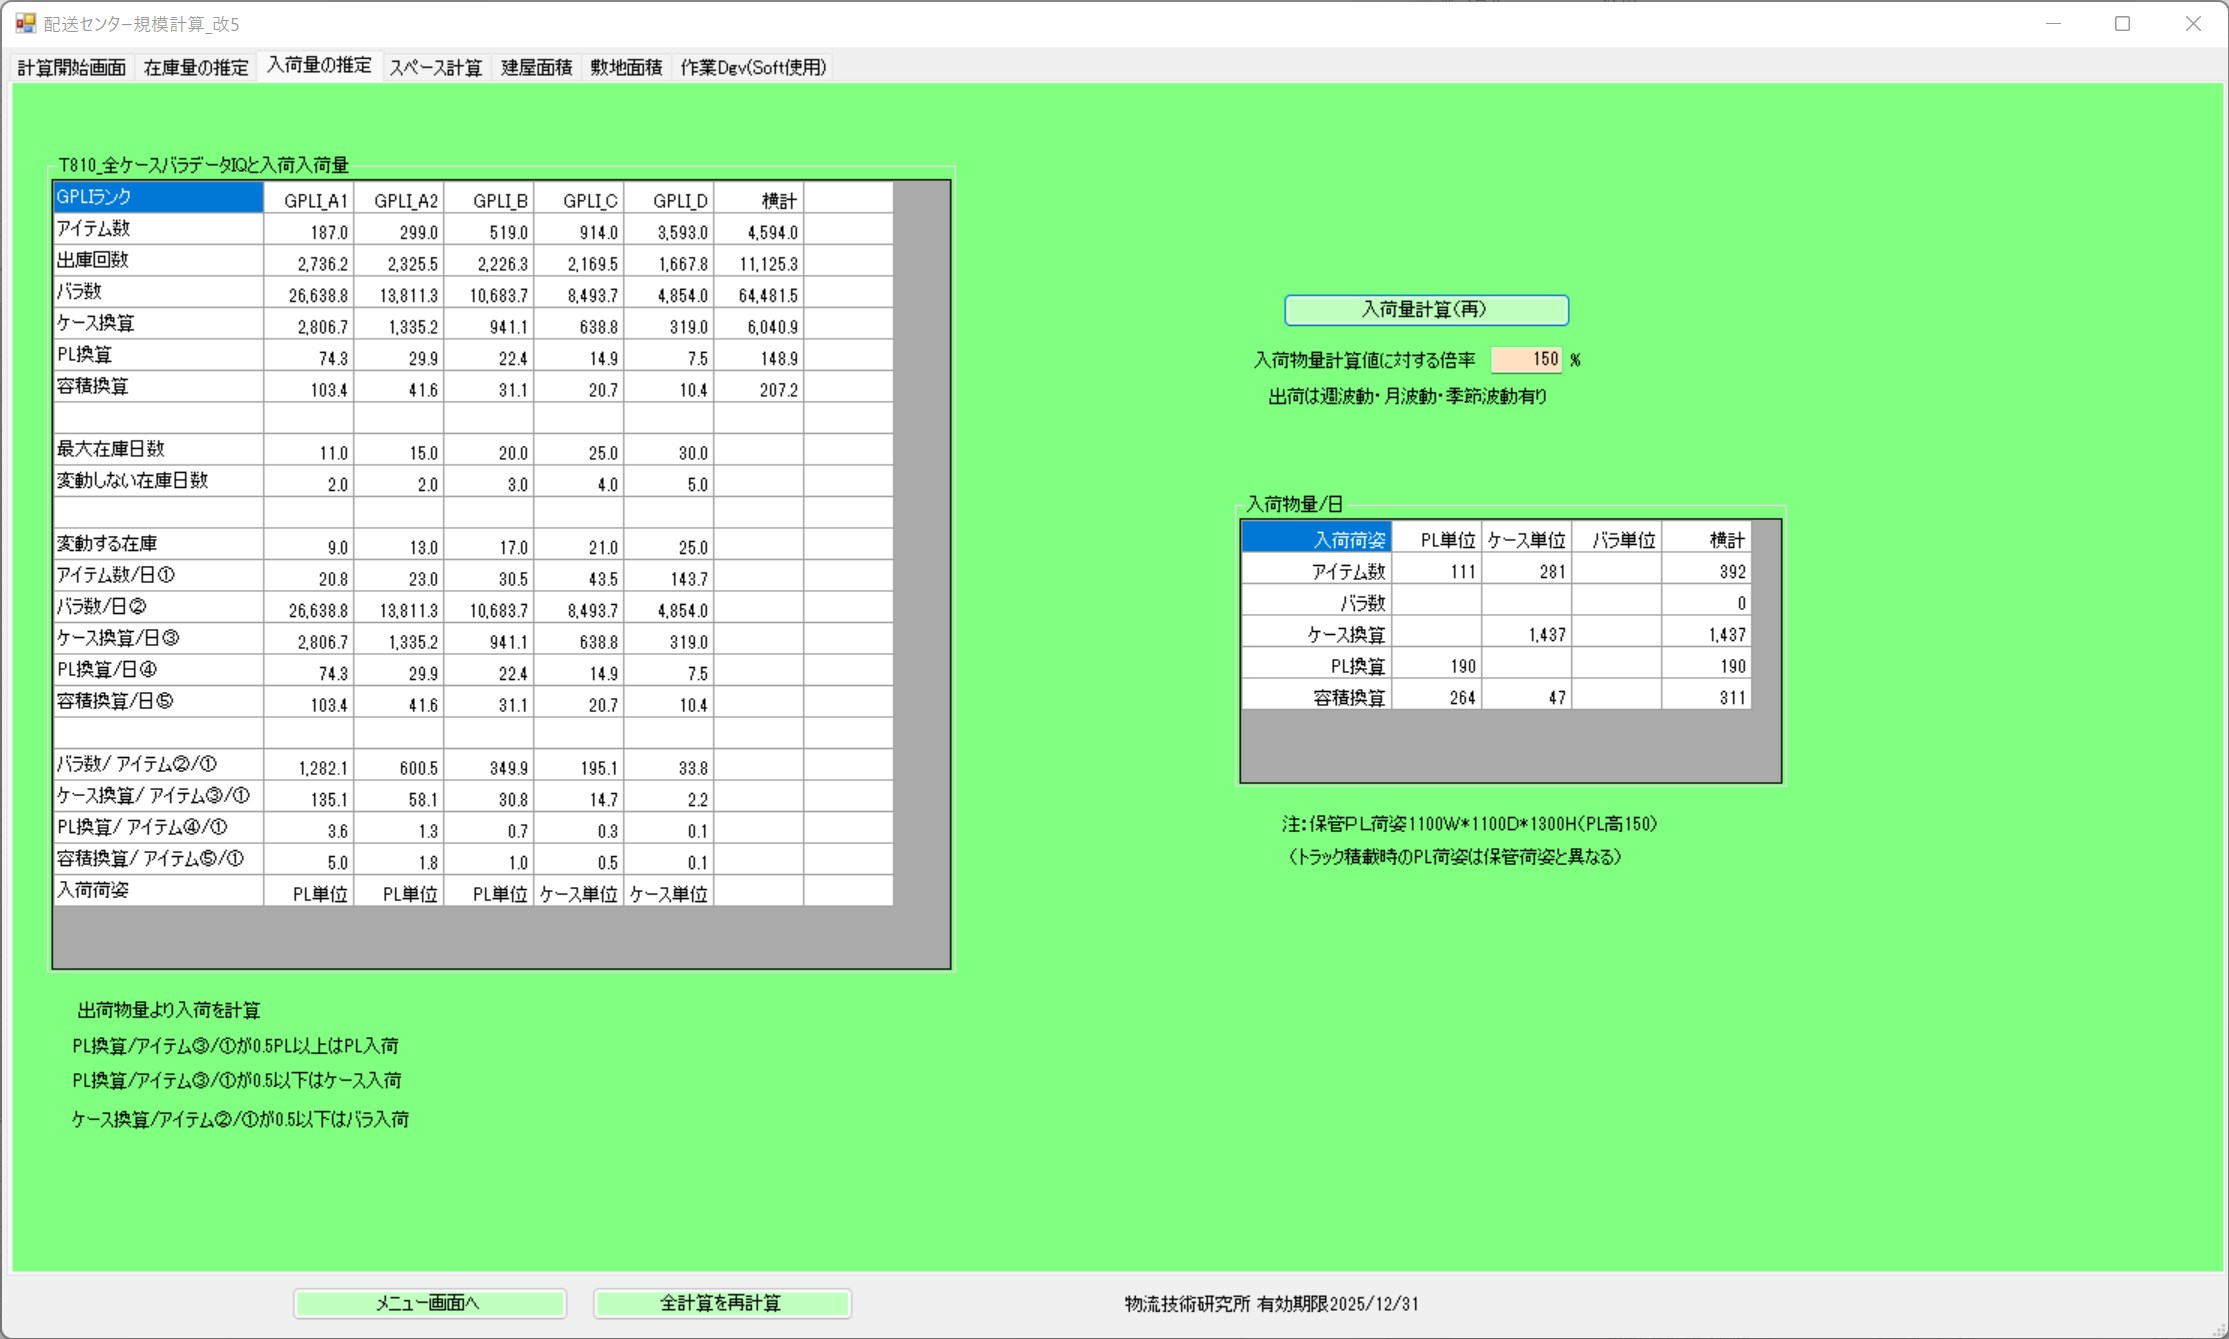
Tera Calculation 2 Data Processing Screen
Section 3: Estimation of Inventory Volume
Based on the philosophy that "inventory exists for the purpose of shipping, and receiving exists to secure that inventory," Tera Calculation back-calculates optimal inventory and receiving volumes from the shipping data, without relying purely on historical performance data.
1. Logic for Estimating Inventory Volume
Inventory volume is managed in units of "Inventory Days (the number of days' worth of shipping volume it corresponds to)."
Key Indicators for Inventory Management
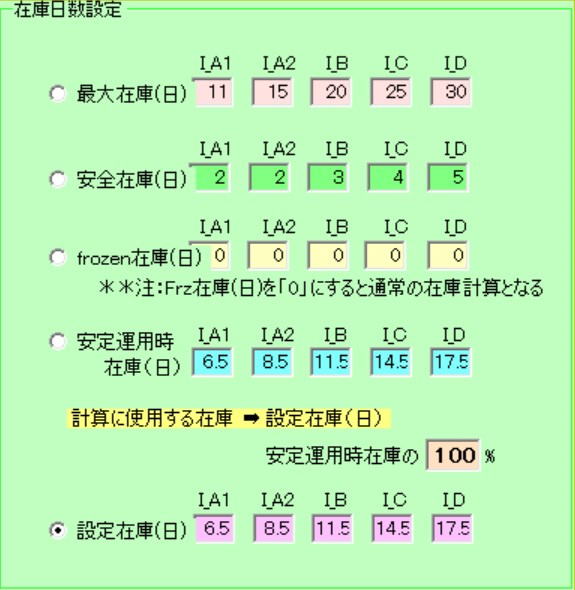
- Maximum Inventory: The upper limit of inventory. Storage will not exceed this amount.
- Safety Stock: The lower limit of inventory. This is always maintained to cope with receiving delays or sudden increases in shipping.
- Fluctuating Inventory: The range obtained by subtracting safety stock from maximum inventory. Daily inventory fluctuates within this range.
- Stable Operation Inventory: A unique term in Tera Calculation; it is a management indicator used to keep the volume in the center constant.
Formula for Stable Operation Inventory

2. Specific Calculation Procedures for Estimating Inventory Volume
Using pallet (PL) conversion as an example, the calculation is performed in the following steps.
- Calculation of Shipping Volume: Calculate the shipping volume for the specified day by item rank.
- Setting Inventory Days: Specify the maximum inventory days and safety stock days, and calculate the stable operation inventory (days).
- Determination of Inventory Quantity: Calculate the total inventory volume during stable operations using "Shipping Volume × Stable Operation Inventory (Days)."
- Classification of Loading Methods (Important): Automatically determine the method of loading onto pallets based on the inventory volume per item (PL conversion).
Criteria for Determining Pallet Loading
| Inventory Volume per Item |
Loading Classification |
| 0.5 PL or more |
Single-item load (1 item per 1 pallet) |
| 0.33 PL to less than 0.5 PL |
2 mixed load (2 items/PL) |
| 0.25 PL to less than 0.33 PL |
3 mixed load (3 items/PL) |
| 0.125 PL to less than 0.25 PL |
4 mixed load (4 items/PL) |
| 0.125 PL or less |
8 mixed load (8 items/PL) |
Practical Points
- Dispersion of Inventory: To minimize storage scale, managing the dispersion of receiving days for each item is effective (e.g., if cycling 180 items over a 6-day fluctuation period, receive 30 items per day).
- Verification of Discrepancies with Actual Performance: By verifying the difference between the "proper inventory volume" derived from shipping data and "actual inventory data," you can discover excess inventory and potential problems.
- Flexible Settings: It is designed to allow simulations by arbitrarily changing maximum and safety stock levels, assuming cases where current inventory is high due to purchasing unit prices or manufacturing lots.
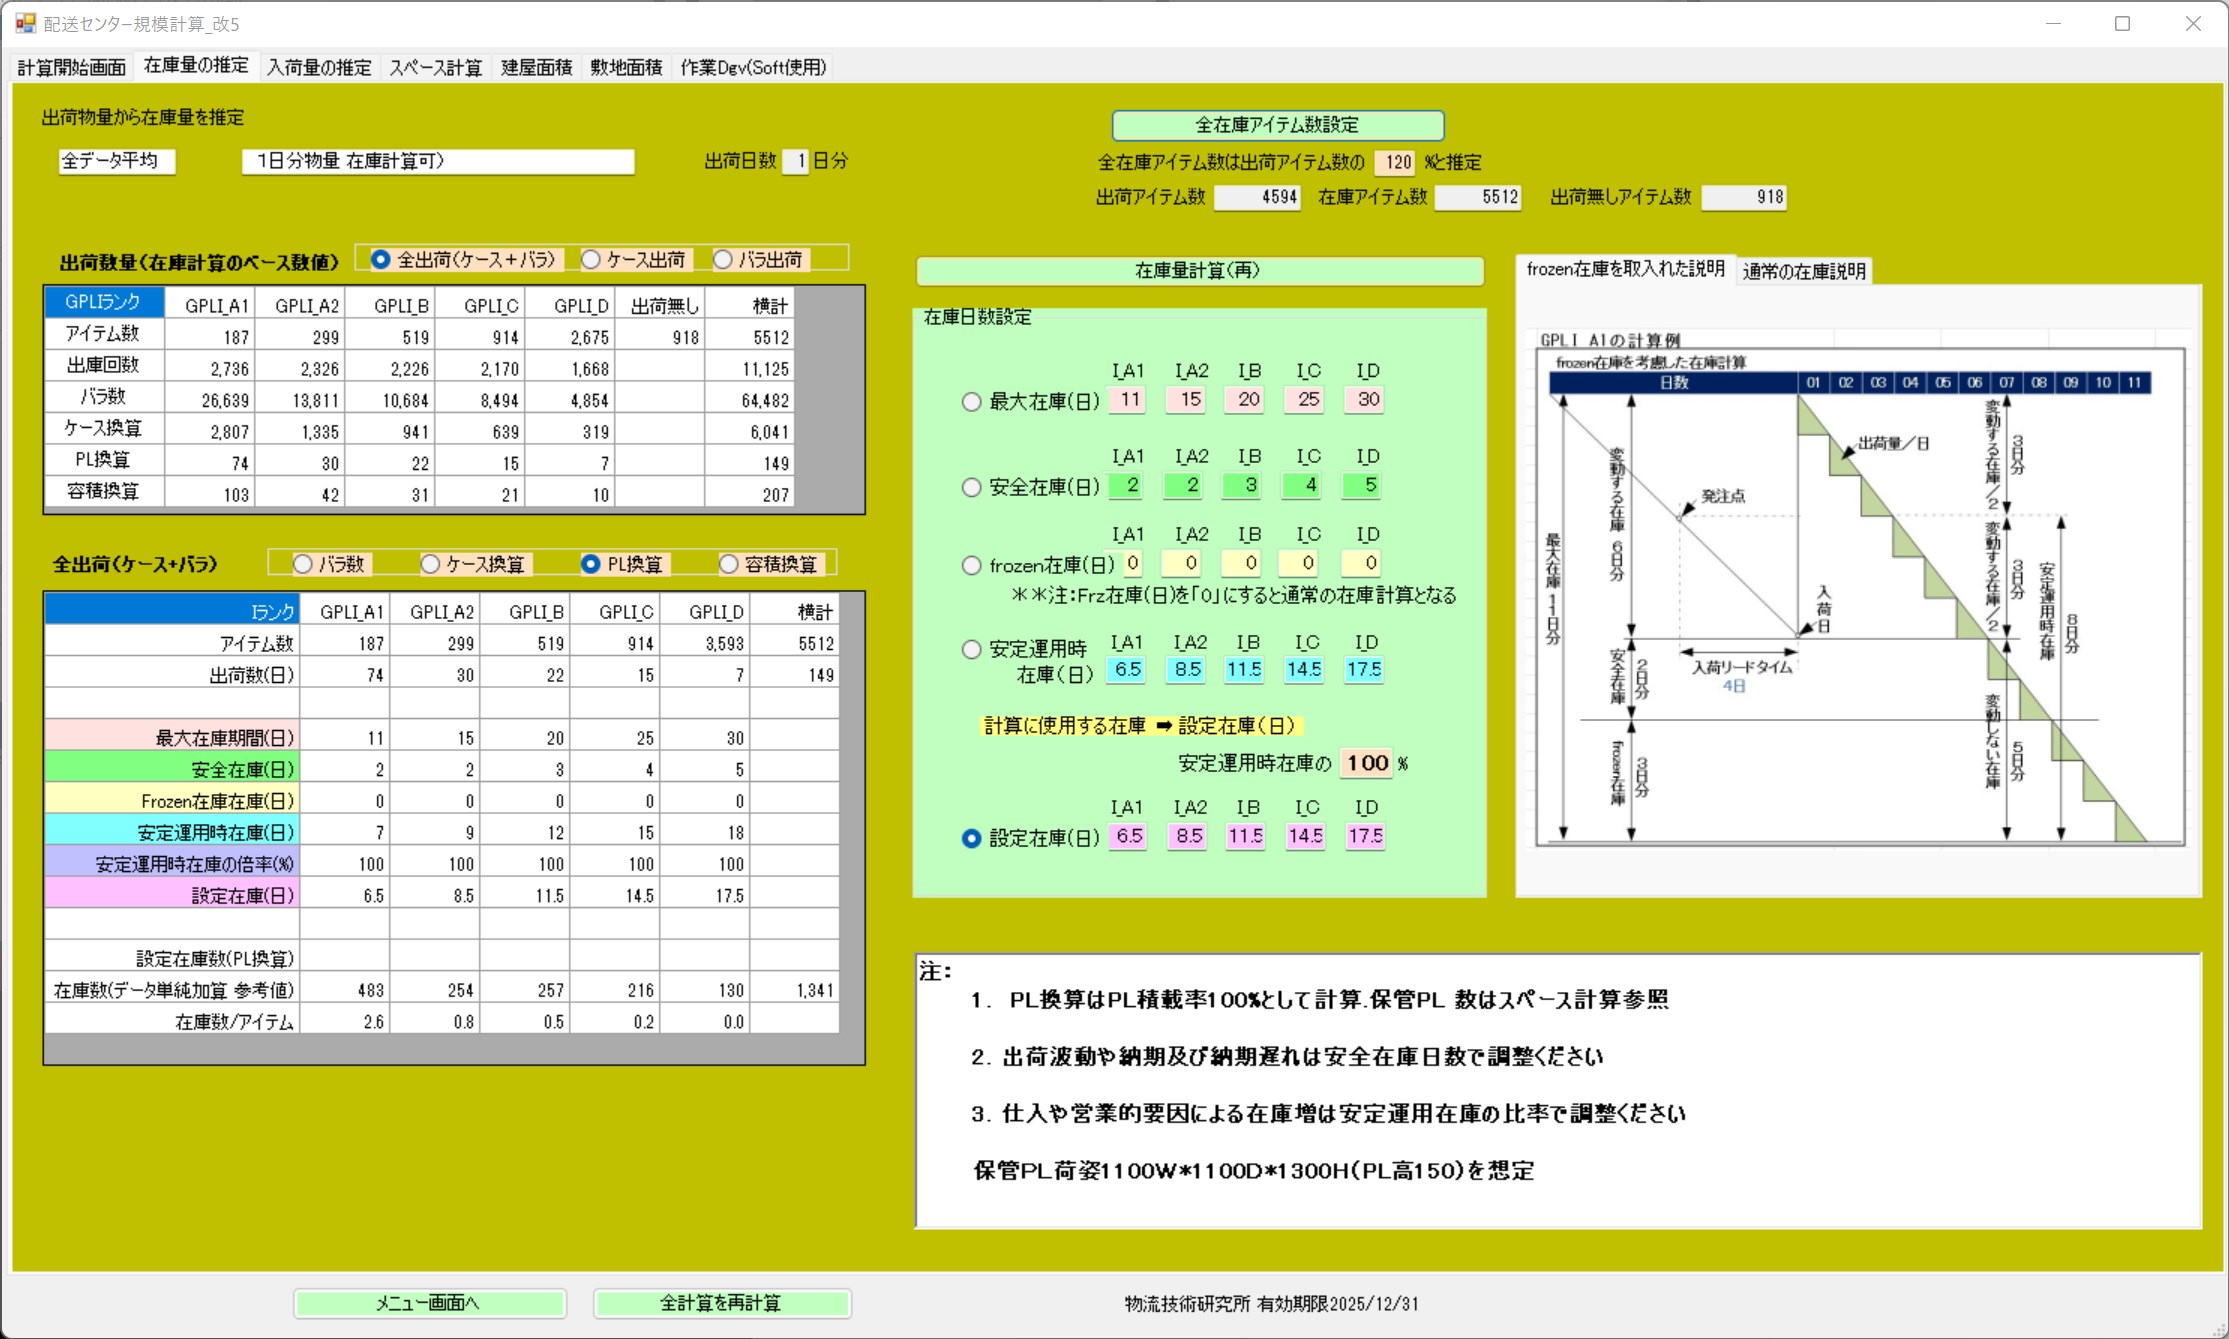
Inventory Volume Estimation Screen
Item 1: Differences Between Average Inventory and Stable Operation Inventory
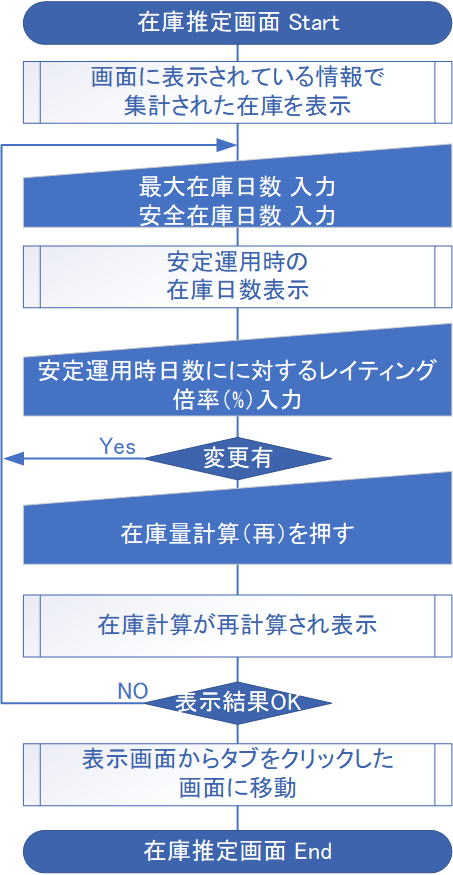
The figure on the left is the flowchart for the inventory volume estimation screen in Tera Calculation 2.
Inventory refers to goods that are received and stored in advance for shipping; inventory volume is that quantity.
Inventory volume can also be expressed in units of inventory days, meaning the volume equivalent to a certain number of days of shipping volume. In Tera Calculation, terms denoted with "Inventory (Days)" refer to inventory days.
Maximum inventory is the upper limit of inventory; stock will not exceed this.
Safety stock is the lower limit of inventory that is always maintained; if there are delays in received goods or higher-than-expected shipping, shipments are drawn from this safety stock.
The inventory obtained by subtracting safety stock from maximum inventory is the fluctuating inventory, and daily inventory fluctuations move up and down within this range.
The reorder point is the inventory on the order date set by back-calculating the period from placing a purchase order to receiving the goods; the inventory at this reorder point is called the minimum inventory. The purchasing agent places a purchase order when the inventory decreases to the minimum inventory.
To adhere to the maximum inventory days and keep the storage scale small, disperse the receiving days of each item (e.g., if there are 180 items with 6 days' worth of fluctuating inventory, receive 30 items a day). By managing "Stable Operation Inventory = Fluctuating Inventory / 2 + Safety Stock", the overall inventory volume of the distribution center can be kept minimal and constant. In Tera Calculation, this managed inventory is called stable operation inventory.
Let's explain with a calculation example. In the diagram below, if the shipping quantity is 10 units/day, then "Maximum Inventory = Shipping Quantity * Maximum Inventory Period = 10 * 8 = 80 units".
"Average Inventory = Maximum Inventory / 2 = 40 units", "Safety Stock = Shipping Quantity * Safety Stock Period = 10 * 2 = 20 units"; if the receiving period is 2 days, then "Minimum Inventory = Safety Stock + (Shipping Volume * Receiving Period) = 20 + (10 * 2) = 40 units".
Tera Calculation's inventory calculation does not compute the average inventory, but rather the stable operation inventory as follows.
"Fluctuating Inventory = Shipping Quantity * (Maximum Inventory Period - Safety Stock Period) = 10 * (8 - 2) = 60 units"
"Stable Operation Inventory = (Fluctuating Inventory / 2) + Safety Stock = 30 + 20 = 50 units"
Considering the calculation above, if purchase orders are repeatedly placed at minimum inventory, then maximum inventory equals minimum inventory; if a 1-day purchase order is repeated daily starting 3 days before shipping, "Safety Stock + Shipping Quantity * 1 Day" becomes the maximum inventory. Like a milk distribution center with a short shelf life, there are distribution centers that operate with same-day receiving and same-day shipping with no safety stock at all.
However, the majority of distribution centers hold an inventory (maximum inventory) that is more than twice the minimum inventory.
Maximum inventory is set by considering company-wide benefits such as differences in purchasing unit prices based on purchase quantity, securing products, or, for manufacturers, securing production lots.
If Tera Calculation set the inventory volume to guarantee shipping quantities purely for the convenience of the distribution center, it would result in low inventory settings that do not match reality; therefore, it is designed so that maximum inventory and safety stock can be arbitrarily changed.
Note: Stable operation inventory is a term used to explain Tera Calculation and is not standard inventory terminology. Also, the "average of inventory" differs in meaning from the inventory term "average inventory." Please confirm the inventory term "average inventory" in other publications.
Item 2: Inventory Volume Estimation
The method of calculating inventory volume from shipping data was described in the previous section.
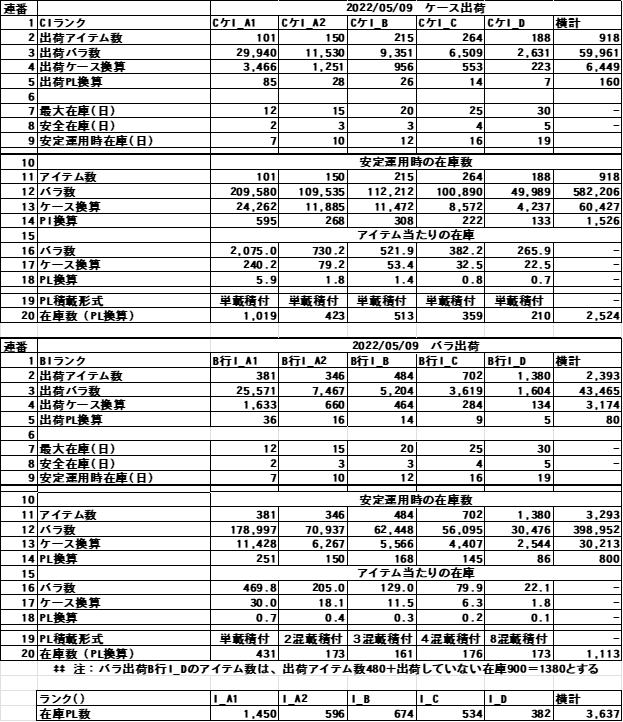
As a calculation example, we will explain the procedure for calculating the inventory volume (PL conversion) from the shipping data of 2022/05/09.
1. Calculate the shipping volume for 2022/05/09 by item rank (Serial numbers 1-5).
2. Specify maximum inventory count (days) and safety stock (days) (Serial numbers 7-8), and calculate stable operation inventory (days); the formula is Stable Operation Inventory = (Maximum Inventory (Days) - Safety Stock (Days)) / 2 + Safety Stock (Days) (Serial number 9).
3. Calculate the stable operation inventory quantity; the formula is Shipping Volume * Stable Operation Inventory (Days).
4. Calculated using Stable Operation Inventory * Shipping Volume (Serial numbers 10-14). Serial numbers 16-18 are calculated as Stable Operation Inventory / Item Count.
5. The key to this spreadsheet calculation is calculating the pallet loading method. Single-item loading loads 1 item per pallet, 2 mixed loading loads 2 items per pallet, and for mixed loading, the leading number indicates the number of items loaded on the pallet.
The method to distinguish between single-item loading and mixed loading is calculated as: single-item load if the inventory per item (PL conversion) is 0.5 PL or more; 2 mixed load for 0.5 PL to 0.33; 3 mixed load for 0.32 to 0.25; 4 mixed load for 0.24 to 0.125; and 8 mixed load for 0.125 or less.
The PL conversion for mixed loading is calculated by Item Count / Number of Items Loaded per PL.
In Tera Calculation, the number of unshipped items is added to the number of shipped items for the B-row I_D rank of piece shipping. Also, when calculating the storage space, the volume is calculated at 1.1 times the above calculation (Tera Settings).
Note:
This calculation is a numerical value derived from a simple aggregation of the PL conversions of the shipping data.
It is necessary to consider the loaded quantity per PL.
Section 4: Receiving Volume Estimation
This document explains the concept and calculation logic of "Receiving Volume Estimation" in a logistics center. It demonstrates a method to derive an efficient receiving plan from shipping data by considering inventory fluctuation cycles.
Below, we organize and explain its main points.
1. Basic Logic of Receiving Volume Estimation
We basically consider the receiving volume to be equivalent to the "shipping volume". However, not all items are received every day; the system is designed to receive them in batches based on the inventory fluctuation cycle (receiving cycle).
- Fluctuating Inventory: The value obtained by subtracting safety stock from maximum inventory.
- Receiving Cycle: Calculated as "Maximum Inventory Days - Safety Stock Days".
- Example: If the cycle is 6 days, receiving occurs every 6 days, and inventory peaks on the receiving day.
- Number of Receiving Items per Day: Calculated as "Total Number of Items ÷ Receiving Cycle".
2. Criteria for Determining Receiving Formats
Based on the receiving volume for each item, it determines whether to receive in units of "Pallet (PL)", "Case", or "Piece".
| Receiving Volume per Item |
Receiving Unit |
Applicable Rank (Example) |
| 0.5 PL or more |
Pallet unit |
GPLI_A1, A2, B |
| Less than 0.5 PL to over 0.5 Case |
Case unit |
GPLI_C, D |
| 0.5 Case or less |
Piece unit |
- |
3. Differences Between Receiving and Shipping Characteristics
As an operational image in a logistics center, the following contrast is important.
- Shipping: Sent out in "high variety, small volume" for each destination.
- Receiving: Brought in in "specific variety, large volume" for each item.
- Perspective of PCB Analysis: Understood as a flow of "receiving in pallet units, and shipping in case or piece units."
4. Examples of Calculation Results and Points to Note
In the calculation examples within the document, the daily receiving volume is estimated as follows.
- Scale: A total of 392 items (190 pallets + 1,437 cases).
- Volume: 311 cubic meters.
[Note]
Because these estimates are based on simple aggregations, during actual operations, it is necessary to consider "the actual loaded quantity per pallet" and correction multipliers based on the center's convenience (such as designating receiving days of the week).
Item 1: Receiving Volume Estimation
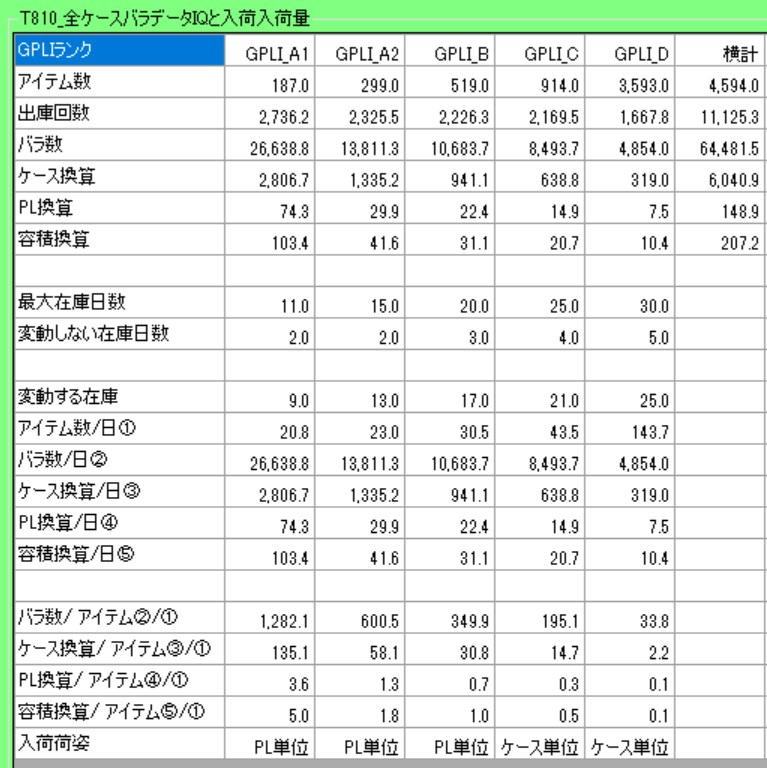
T810_All Case/Piece Data IQ is calculated from the average value of all shipping data.
Inventory fluctuates between the maximum inventory and safety stock.
Fluctuating Inventory = Maximum Inventory - Safety Stock
If Fluctuating Inventory Days = 6 days, receiving occurs on a 6-day cycle, reaching maximum inventory on the receiving day; the fluctuating inventory becomes 0 just before the next receiving day's incoming stock is confirmed.
(Theoretically, the inventory becomes only the safety stock.)
Receiving Volume = Shipping Volume
Receiving Cycle = Maximum Inventory Days - Safety Stock Days
Receiving Item Count = Item Count / Receiving Cycle
If the receiving volume per item is 0.5 PL or more, receiving is in pallet units.
0.5 PL or less is case unit receiving,
0.5 case or less is piece unit receiving.
GPLI_A1, GPLI_A2, and GPLI_B result in PL unit receiving,
and GPLI_C, GPLI_D result in case unit receiving.
Receiving Volume Calculation Results
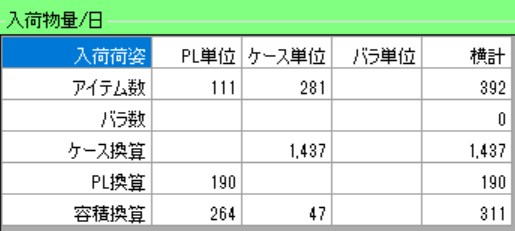
Receiving volume per day:
111 items are received in pallet (PL) units totaling 190 pallets,
and 281 items are received in case units totaling 1,437 cases.
A total of 392 items are received as 190 PL + 1,437 cases.
The volume at that time is 311 m3.
Note:
This calculation is a numerical value derived from a simple aggregation of the PL conversions of the shipping data.
It is necessary to consider the loaded quantity per PL.